ESG Analytics
Analysed ESG performance of energy companies worldwide help companies understand, predict, and improve their ESG performance using state-of-the-art machine learning techniques. 2 models are created, a Two Layer Model with 1 Random Forest Regressor layer and 1 OLS Linear Regression layer, and a Reinforcement Learning model using Q-learning to predict the ESG score of a company.
Data is taken from Bloomberg, S&P and the United Nations. Project is done as part of the Business Analytics Consulting module in partnership with Aon.
Technologies used:
Python Pandas NumPy Scikit-learn Matplotlib Seaborn PyTorchAI Customer Support
An AI powered chatbot featuring a customer support, financial planner and stock market analyst assistants. It uses OpenAI and Gemini APIs to provide accurate and relevant responses to user queries, with a RAG approach to query a Milvus vector database for relevant information.
The frontend is built with React, and the backend is built with Node.js and Firebase. You can access the app at ai-customer-support-woad.vercel.app.
Technologies used:
React Node.js Firebase OpenAI API Google Gemini API HuggingFace API MilvusPACE Chess Engine
Pace (Predictive Alpha-beta Chess Engine) is a chess engine featuring alpha-beta with quiescene search (negamax) written in C. It supports both UCI and Xboard protocols and also features a console mode.
Technologies used:
C DoxygenCamp Application and Management System
A Java-based application for managing camps for students in NTU. It features authentication, user management, camp management, and communications between students, camp committee members, and staff.
Technologies used:
Java Visual ParadigmParkBuddy
A Flutter based application to view parks and their facilities in Singapore. Features review and rating system, and a facility booking management system on top of basic user profile controls
I prototyped the app on Figma and created the backend Python Flask server, including setting up the API endpoints to connect to the frontend client instance. Connection is done over the internet using ngrok to tunnel from my computer acting as the server.
Technologies used:
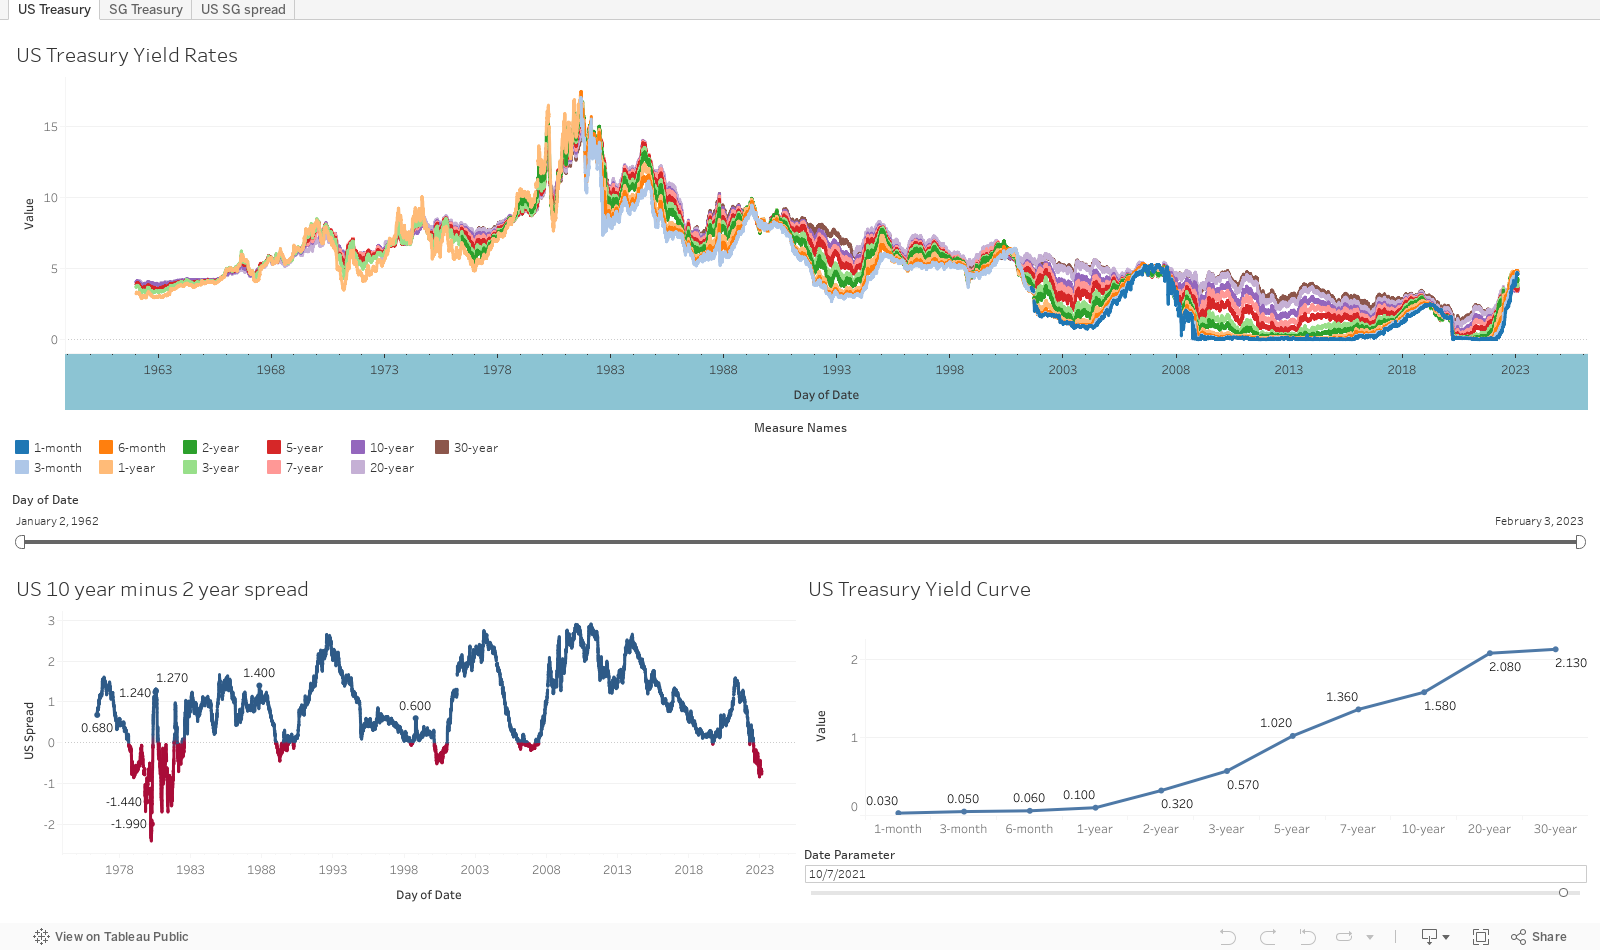
Flutter Figma Python Flask SQL ngrokUS Treasury Yield Prediction
Scrapped data from the US Department of Treasury and Monetary Authority of Singapore to get the yield curve data for the US and Singapore. Used Tableau to create an interactive dashboard to show the historical yield curve data and spread between the US and Singapore. Showcased interactive dashboard during a presentation during Management Accounting class.
Technologies used:
Tableau Python